The golden ratio face is one of the most searched beauty ideas online: measure enough distances on a face, compare them with 1.618, and get a percentage that supposedly says how beautiful it is. It is also one of the best-tested ideas in facial research, and it keeps failing those tests.
This page gives you both halves. First, where the idea came from and what the studies found, with numbers. Then a measurement you can actually use: the scan above draws the ratios on your own photo and compares you only with values that were tested on real raters, with their limits stated.
Where did the golden ratio face idea come from?
The golden ratio itself is real mathematics. It is the irrational number 1.6180339…, which the Greek mathematician Euclid described as cutting a line “in extreme and mean ratio”: the whole is to the longer part as the longer part is to the shorter. Euclid, as Naini points out in his 2024 review, treated it as an ordinary ratio with no special powers.
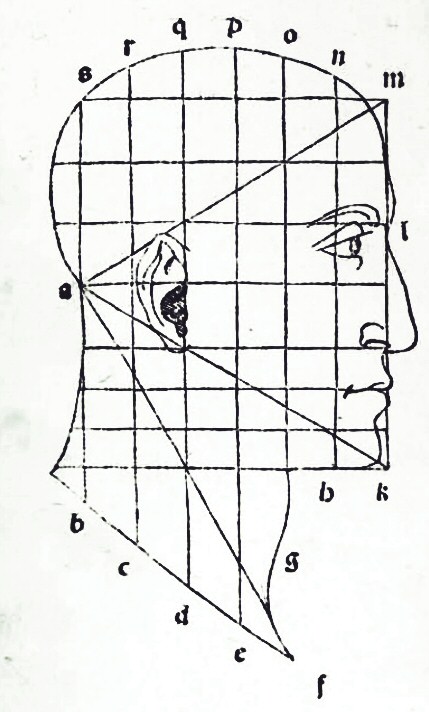
The phrase people now search as “divine proportion” comes from Luca Pacioli, a mathematician and monk who wrote De Divina Proportione (On Divine Proportion) in 1498; the illustrated edition was printed in Venice in 1509. Naini notes that, contrary to popular myth, Pacioli did not argue that the golden ratio was the secret to beauty, and that Leonardo da Vinci, who drew geometric figures for the book, did not use the golden ratio in any of his drawings of human proportion.
The beauty claim is much younger. It was the German psychologist Adolf Zeising, in the mid-nineteenth century, who tried to prove that the golden section was the key to beauty in nature, art and the human body. In the twentieth century the idea moved into dentistry and cosmetic surgery, most visibly through the Marquardt “phi mask”, a grid of golden proportions laid over a face. Online golden ratio calculators work the same way: they compare a set of facial distances with 1.618.
What does the research say about 1.618 and beauty?
The golden ratio face has been put to the test many times, on different populations, with different methods. The results line up remarkably well, and none of them support 1.618 as a formula for an attractive face.
The most direct test is Kiekens and colleagues (2008). They measured 19 putative golden proportions on 64 adolescents and had 76 adult laypeople rate the faces. Only 4 of the 19 proportions correlated significantly with the ratings, and together they explained only 16% of the variance. Holland (2008) analysed the Marquardt mask itself and found it best describes the proportions of “masculinized white women” as seen in fashion models, and fits non-European faces poorly.
There is no convincing evidence that the golden ratio is linked to idealized human proportions or facial beauty.
— Naini (2024), The golden ratio: dispelling the myth
| Study | Who was measured | Finding |
|---|---|---|
| Kiekens et al. 2008, Am J Orthod Dentofacial Orthop | 64 white adolescents, rated by 76 adults | 4 of 19 golden proportions related to ratings; 16% of variance explained |
| Holland 2008, Aesthetic Plast Surg | Marquardt phi mask vs average faces | Mask describes masculinized white fashion-model faces; ill-suited to non-European faces |
| Alam et al. 2015, PLOS ONE | 286 Malaysian students (Chinese, Malay, Indian) | 17.1% had an “ideal” golden facial shape; no link with how they rated their own appearance |
| Burusapat & Lekdaeng 2019, PRS Global Open | 16 Miss Universe and 16 Miss Universe Thailand winners | 12 of 16 golden ratios differed significantly from phi in both groups |
| Zwahlen et al. 2022, Maxillofac Plast Reconstr Surg | 30 3D face scans rated by 101 laypeople and 60 patients | 42 of 77 measurements in attractive female faces differed from the “ideal”; few ratios related to ratings |
| Khoshab et al. 2022, Aesthet Surg J | Raw data from 27 studies, 6 ethnic groups | No ethnic or gender group consistently matched the canons or phi |
| Naini 2024, Maxillofac Plast Reconstr Surg | Historical review | No convincing evidence linking the golden ratio to facial beauty |
Why do golden ratio calculators give such different results?
Because a ratio is only as meaningful as the two points it's measured between, and golden ratio tools choose those points freely. Face length can mean hairline to chin, the bridge of the nose to chin, or the top of the head to chin. Face width can mean cheekbone to cheekbone, ear to ear, or the edge of the jaw. Each choice produces a different number, so the same face can come out “92% golden” on one site and “71%” on another.
Here is how large the effect is. In the US Army's ANSUR II survey of 6,068 soldiers, measured with calipers, the length from the nasal root to the chin divided by the cheekbone width averages 0.861 in men and 0.847 in women (our calculation from the public raw data). On that definition the face is shorter than it is wide, nowhere near 1.618. Alam and colleagues, measuring 286 young adults with their own facial index, found group means of 1.54 to 1.59 and classed only 17.1% as “ideal”. Same human faces, completely different ratios.
Then there is landmark error. Google's model card for the face landmark model behind most browser tools, including ours, reports average errors of about 2% to 3.3% of the distance between the eyes. A calculator that reports your “golden match” to one decimal place is claiming more precision than the measurement has.
Which ratios does FaceCheckup measure instead?
We score only two proportions, because they are the only ones we found that were tested directly against people's attractiveness ratings and that our scan can measure in a comparable way. They come from Pallett, Link and Lee's 2010 paper in Vision Research, titled “New ‘golden’ ratios for facial beauty”. In four experiments, faces were rated most attractive when the vertical distance between the eyes and the mouth was about 36% of face length (hairline to chin) and when the distance between the pupils was about 46% of face width. Those values matched the average of 40 female faces, which fits the wider finding that averaged faces are attractive.
Two honest limits. Pallett's study used photos of Caucasian women's faces only. And they measured face width between the inner edges of the ears, while our scan uses the widest outline points at cheekbone level, which sit close to that line but not exactly on it, so treat a match as approximate. The eyes-to-mouth ratio also needs your hairline, which our hair-segmentation model finds only when the hair is visible above the forehead.
In the tool, switch on the Ratios layer. It draws the pupil-to-pupil line, a vertical line from the pupils down to the mouth, and the face width line. The results show “Pupil distance ÷ face width” and “Eyes-to-mouth ÷ face length” with a ± range from four framings. Within 2 percentage points of 46% or 36% counts as a match; beyond that, the proportions part of the Balance Score loses one point per further 2 percentage points, at most 2 points per ratio.
Everything else the scan measures, such as face length ÷ width, middle ÷ lower third, eye spacing, nose width ÷ eye gap and mouth width ÷ nose width, is shown as a plain number. Published norms for those use different landmark definitions, so we don't compare you with them, and we never compare anything with 1.618.
What about the rule of fifths and the other “ideal face” rules?
Golden ratio calculators often bundle in the neoclassical canons from Renaissance art: the face is five eye-widths across, the gap between the eyes equals one eye width, and the nose is as wide as that gap. These are drawing conventions, and measurement studies find them rare in real faces. The one-eye-apart rule held in anywhere from 0% of southern Chinese adults to about a third of North American white adults and Kenyan men, depending on the study.
Our scan does show eye spacing (the gap between the inner eye corners divided by eye width) and nose width ÷ eye gap on the Fifths layer, because people want to see them. It doesn't score them, and a value other than 1.0 is not a flaw. The facial thirds page covers the vertical canon in the same way.
How to measure your face properly
A ratio from a bad photo is worse than no ratio. These steps take two minutes and remove the biggest errors.
- Prop your phone at eye level about 1 to 1.5 m away and use the timer. Close selfies make central features look wider; at about 30 cm the base of the nose appears roughly 30% wider relative to face width than at 1.5 m (Ward et al., 2018).
- Look straight into the lens with a relaxed, neutral face and your lips together. Smiling changes the eyes-to-mouth distance directly.
- Pull your hair back off your forehead so the hairline is visible; otherwise the eyes-to-mouth ratio and face length are skipped.
- Take off glasses and stand in even window light.
- Run the scan, check the quality notes, and retake if it asks you to.
- Read each ratio with its ± range, and compare two or three photos before believing any small difference.
What to do with your result
If your two Pallett ratios fall within the matching range, that's a nice confirmation that your eye and mouth placement is close to an average face. If they don't, you've learned something about one photo of one face against a study of female Caucasian faces, and very little about how attractive anyone finds you. Hönekopp (2006) showed that private taste explains about as much of attractiveness ratings as shared taste does.
The useful part of the scan is the style plan it builds from the same measurements: haircut, brows, glasses and photo tips drawn from our sourced rulebook, each labelled as a stylist, optician, makeup-artist or photographer convention, or as research-supported. For example, the research-supported photo tip is to shoot from about 1.5 m with the zoom rather than at arm's length, because close-range photos were rated less attractive than the same faces photographed from farther away (Bryan, Perona and Adolphs, 2012).
If you came here from a looksmaxxing forum, our PSL scale page explains where those ranking systems come from and why they aren't scientific, and the facial symmetry test page covers the other measurement people pair with the golden ratio.
Questions people ask
- What is the golden ratio of a face?
- It is the claim that attractive faces have many distances in the ratio 1.618 to 1, usually face length to width plus a set of smaller feature ratios. Research has not supported it: in the most direct test, only 4 of 19 golden proportions related to attractiveness ratings.
- What is the divine proportion face?
- The same idea under its older name. “Divine proportion” comes from Luca Pacioli's book De Divina Proportione (written 1498), but Pacioli did not claim the ratio was the secret of beauty. The beauty link was argued later, from the nineteenth century on.
- Is a golden ratio face calculator accurate?
- It can measure distances consistently, but the comparison it makes has no research behind it, and the points each tool uses differ, so the same face gets different percentages on different sites. Landmark error of about 2 to 3% of the eye distance also limits precision.
- Does the golden ratio apply to men's faces?
- The claim is usually applied to everyone, and the tests include men: Alam and colleagues' 286 Malaysian students included 136 men, and only 17.1% of the whole sample had the “ideal” golden facial shape. The two ratios FaceCheckup scores come from a study of female faces only, which we say next to your result.
- Who has the most golden ratio face?
- Lists of celebrities with the “most golden” faces come from press articles and private calculations, not peer-reviewed studies. When researchers measured Miss Universe winners, 12 of 16 golden ratios differed significantly from phi.
- Can you change your face to match the golden ratio?
- Since the ratio isn't a validated beauty standard, there's nothing to match. This site gives no medical or cosmetic-procedure advice; if you're considering a procedure for any reason, talk to a licensed professional. Styling and photo choices are covered in your scan's style plan.
- Why do some websites say my face is 90% golden?
- Because they compare a handful of distances with 1.618 and turn the closeness into a percentage. Change which points they measure, or the camera distance, and the percentage changes. None of the peer-reviewed studies in our sources found that such a score predicts how attractive people find a face.
Sources & further reading
- Naini FB (2024), Maxillofacial Plastic and Reconstructive Surgery: The golden ratio: dispelling the myth
- Kiekens RM et al. (2008), Am J Orthod Dentofacial Orthop: Putative golden proportions as predictors of facial esthetics in adolescents
- Holland E (2008), Aesthetic Plastic Surgery: Marquardt's Phi mask: pitfalls of relying on fashion models and the golden ratio
- Alam MK et al. (2015), PLOS ONE: Multiracial facial golden ratio and evaluation of facial appearance
- Burusapat C, Lekdaeng P (2019), PRS Global Open: What is the most beautiful facial proportion in the 21st century?
- Zwahlen RA et al. (2022), Maxillofacial Plastic and Reconstructive Surgery: Does 3-dimensional facial attractiveness relate to golden ratio, neoclassical canons, 'ideal' ratios and 'ideal' angles?
- Khoshab N et al. (2022), Aesthetic Surgery Journal: Historical tools of anthropometric facial assessment
- Pallett PM, Link S, Lee K (2010), Vision Research: New “golden” ratios for facial beauty
- ANSUR II public data, US Army 2012 anthropometric survey (Gordon et al. 2015), via Penn State OPEN Design Lab
- Jayaratne YS et al. (2012), PLOS ONE: Are neoclassical canons valid for southern Chinese faces?
- Al-Sebaei MO (2015), Head & Face Medicine: The validity of three neo-classical facial canons (quoting Farkas et al.)
- Virdi SS, Wertheim D, Naini FB (2019), Maxillofacial Plastic and Reconstructive Surgery: Normative anthropometry of the Kenyan-African face
- Hönekopp J (2006), J Exp Psychol: Human Perception and Performance: Once more: is beauty in the eye of the beholder?
- Ward B et al. (2018), JAMA Facial Plastic Surgery: Nasal distortion in short-distance photographs
- Bryan R, Perona P, Adolphs R (2012), PLOS ONE: Perspective distortion from interpersonal distance
- Yan G, Grishchenko I (Google, 2022): Model Card, MediaPipe Face Mesh V2
- Wikimedia Commons: Pacioli, De Divina Proportione, head with equilateral triangle (1509), public domain
Read next
- Facial symmetry test
Facial symmetry test that mirrors 220 landmark pairs on your own photo, corrects head turn, and shows a ± range. Free, private, no sign-up.
- Facial thirds
Facial thirds measured free on your photo, no sign-up: hairline, brows, nose base and chin drawn for you, plus how rarely thirds are equal in studies.
- Midface ratio
Midface ratio measured free on your photo, no sign-up: pupil distance ÷ pupils-to-lip height with a ± range, the three definitions and the research.
- PSL scale
PSL scale explained: its forum origin, how the tiers are laid out, why no percentile backs them, and a free face test with no sign-up.
- Face shapes
Face shapes explained: oval, round, square, oblong, heart, diamond and triangle, how stylists define each, and a free detector with no sign-up.
Part of Facial symmetry test. Take the full free attractiveness test on the FaceCheckup home page.

Sukie · Founder and editor
Sukie built FaceCheckup because she always wanted a face tool that explains its numbers and tells you what to do with them, and nothing on the market did both. She checks every measurement on the site against published research and labels every tip for what it is: research, or stylist convention.
About this site · How pages are checked · Last updated October 23, 2026
FaceCheckup is for information and entertainment. It measures proportions in one photo; it is not a medical, psychological or cosmetic-surgery assessment, and it cannot tell you your worth.